The healthcare industry is swimming in data; sometimes organizations can even feel like they are drowning in available information. To stay afloat, health plans need systems and strategies for unifying disparate sources, sifting through the sea of data, and extracting meaningful, actionable insights. When done well, robust analytics have enormous power to impact population health management and improve patient outcomes. The ability to adeptly identify important patterns and risks (both health and financial) can spur quicker intervention and preventive actions.
Though there are a plethora of metrics available that require attention and management, today we will focus primarily on how to marry—and maximize—medical and pharmacy data to better understand patient behavior and costs as they relate to diagnoses.
Why Rx data is a critical piece of the population health puzzle
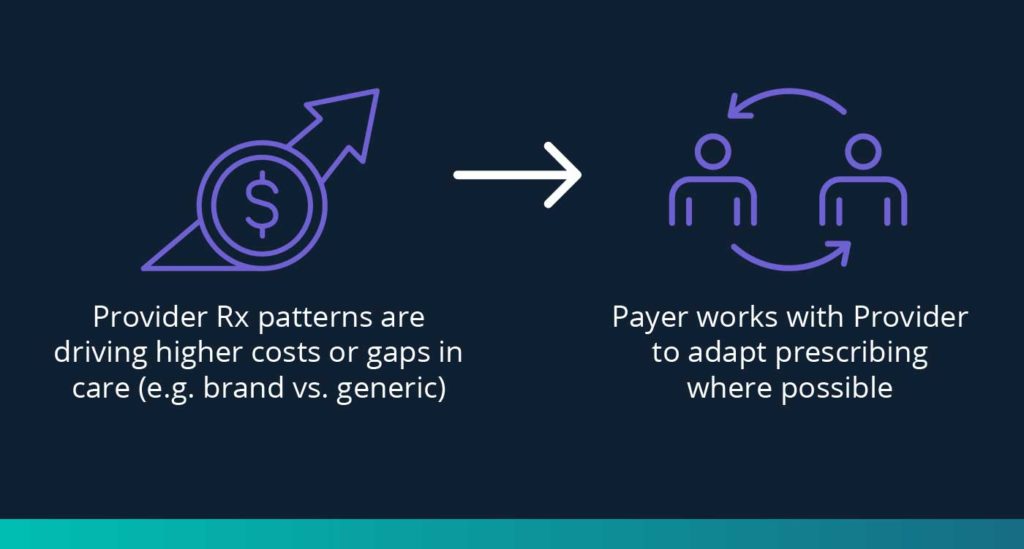
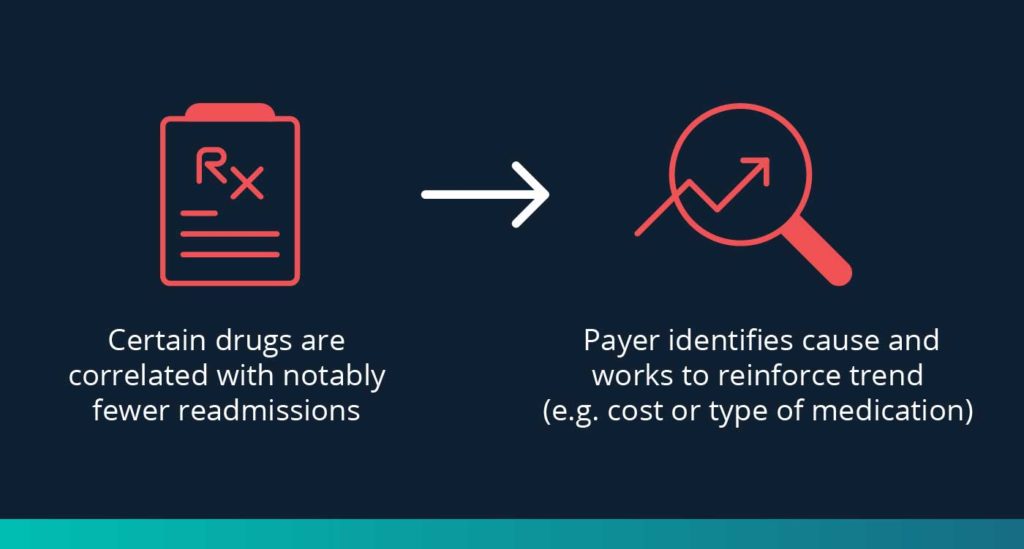
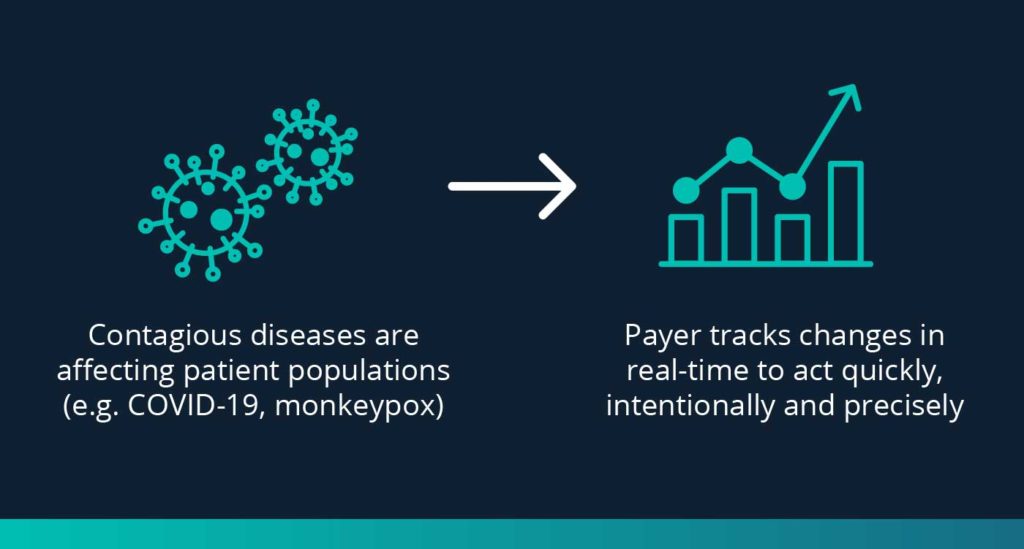
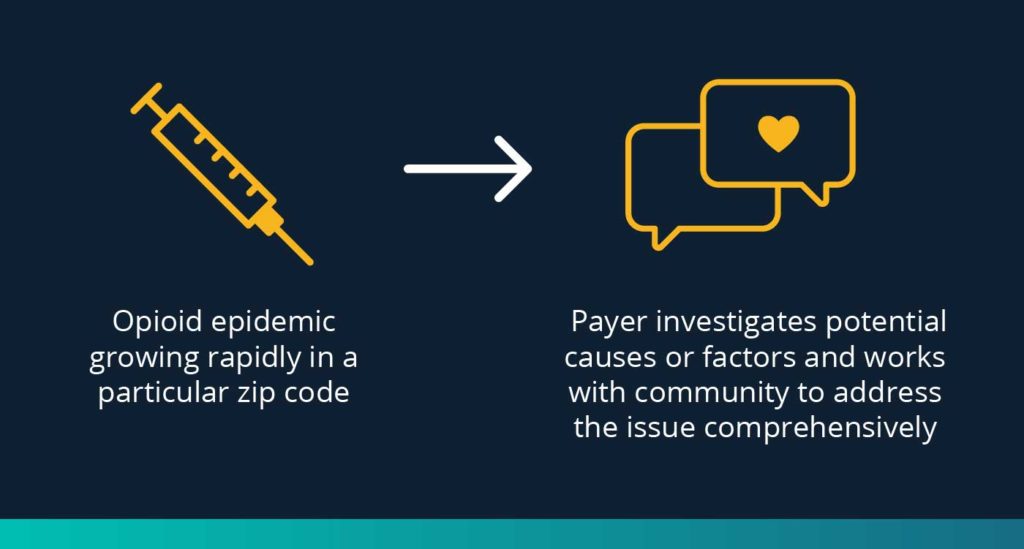
Payers who can drill into patients’ unique medication histories are able to closely track adherence patterns, risks and costs. Access to these insights is essential for health plans working to develop and apply preventative programs, awareness campaigns and proactive interventions. As we like to say, “an ounce of prevention is worth a pound of cure.” Consider a handful of examples where data can make a big difference for health plans’ population health efforts (Download the full infographic):
If Rx data is so powerful…why isn’t everyone using it?
As we’ve seen, pharmacy data holds significant potential. However, this data comes from multiple disparate sources in a variety of formats, making it challenging to interpret patterns, understand impacts, and improve care pathways. When pharmacy claims come in with medications, there isn't clarity on what health issue they are addressing for patients; and when medical claims come in, there are no drug details attached to understand the true, full costs related to medical events (and their claims). A comprehensive picture is needed. Working this data into a unified, meaningful set of information is a complex and manual process—and health plans don’t usually have the resources available or capacity necessary to handle it in a timely manner.
How innovative health plans are solving this challenge
To make the most of pharmacy data, payers are starting to rely on powerful data analytics solutions for efficient data synthesis, comprehensive reporting and actionable insights. An experienced analytics partner can empower payers with the holistic patient data they need to make smarter, more proactive decisions. Essential metrics available in an intelligent analytics platform include:
- Correlations between costs of and adherence to medications for chronic conditions
- Drug cost trends over the past year based on diagnoses, with peer comparisons available across the industry
- Comparison of costs and outcomes of care provided across various access points (e.g., hospital vs. clinic vs. at-home)
- Opioid prescription habits based on diagnosis, with comparison to industry norms
Quick, easy access to these data points is a gold mine for health plans working to improve population health. They can start answering questions like:
- Due to non-adherence, which chronic conditions create the most readmissions?
- What are the highest hospital stay drug costs over the past year based on diagnoses, and how does this compare to others in the industry?
- What are the top conditions when opioids are provided? Do opioid prescriptions for these conditions align with industry norms?
- How much are high-cost claimants with and without pharmacy costs attached? How do the results change?
Who should be engaged in maximizing Rx data?
Though we have primarily focused on health plans in this post, it’s critical to note that understanding trends specific to pharmacy is not exclusively meaningful to insurers. Organizations throughout the industry—including employer groups, providers and care management—have much to benefit from access to prescription insights. For example, having access to robust data can lead pharmaceutical companies driving their research and clinical trials in certain directions based on disease trends.
How to get started
Diving into data analysis and orchestration can seem daunting—but it doesn’t have to be. With the right partner, you don’t have to worry about finding the time or expertise necessary to effectively process and synthesize prescription data with other data sources. MedeAnalytics can help you put prescription insights to work to improve costs and care for your members. Let’s chat. We can’t wait to collaborate with you.
Get our take on industry trends
Best practice tools to build an integrated approach to multimorbidity
The traditional model of treating single diseases no longer works. Data collected from 2016 to 2019 indicated that 32.9% of…
Read on...Will adopting a risk-based approach with augmented analytics support care gap closure?
A common challenge for healthcare systems is how to properly segment its patient populations based on risk profiles and co-morbidities. Doing this well ensures a high quality of care delivery and superior patient outcomes.
Read on...4 questions healthcare executives are asking about augmented analytics
At our annual Impact Summit, I had the privilege to talk about augmented analytics and address questions from healthcare executives—many…
Read on...


