Crawl: Bringing Data Science into your Organization
Throughout my career as a data scientist, I’ve been lucky enough to have a few opportunities to build data science teams, processes, and models from the ground up. Introducing data science into your organization can feel overwhelming, so I’ve put together some recommendations to help you along the way.
While it’s incredibly tempting to jump into the deep end and start training Deep Learning systems to solve the hardest problems that have been plaguing your company, I’d recommend a slower, progressive implementation.
One way to incorporate data science into your organization is a three-phased approach that I’ll refer to as Crawl, Walk, Run. To explain each phase in a way that will be useful to you, I’ve distilled the most important points and recommendations for each into this blog series.
If you don’t have any data science implemented yet, Part One: Crawl will help you get started. Parts Two and Three (Walk and Run) will still be relevant, though, as they will help you establish your initial workflow while keeping “what’s to come” in mind.
If you already have a data science group successfully developing and deploying models, follow along in the series for Part Two: Walk or Part Three: Run. These phases might provide additional practices you can implement if you aren’t focusing on them already – like quality control and responsible modeling.
Part 1: We’re crawling!
Defining a workflow
If you’re just introducing data science at your organization, you get to build out the entire workflow for the first time. While it can understandably feel a bit overwhelming, it is an exciting time, and there are many free resources available online to help guide you along the way.
You get to:
- play with a lot of fun technology and investigate which tools work best for your organization,
- define best practices for data collection and usage, and
- discover how to effectively present the results to the end-users.
Part of the process is building organizational confidence in the models and learning how to set realistic expectations of modeling. A large part of that confidence depends on everyone understanding the data science lifecycle.
Understanding the lifecycle
There are five basic steps to a data science lifecycle:
- problem discovery,
- data collection and cleansing,
- exploratory data analysis,
- model development, and
- communicating the results.
While these are the basic steps, it is important to remember that the lifecycle is not linear, but, rather, a feedback loop. There is a high potential you may have to start over completely or go back a step or more at any point in the process (see illustration below).
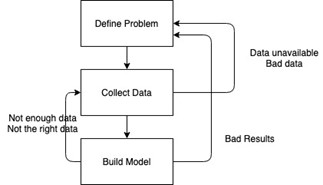
After attempting to build the model or even after analyzing relationships between the data, you may realize you haven’t collected all the data you need. You may need a larger sample, or you may find entire fields that are important to the analysis are missing. Sometimes you may collect all the data only to find out after the initial analysis that the data you collected was bad.
Even if you can collect high-quality data, that doesn’t mean you’ll have a model that produces valuable results. A poorly performing model can happen for many reasons. It could be that there just isn’t a pattern in the data that you’re analyzing–it’s all noise. Or, if you’re trying to assess the success of a newly implemented program, perhaps enough time hasn’t passed to see measurable changes. There’s also always the possibility that the original question may not be defined well enough.
Because any or all the above may occur, it’s important for all involved to realize that the data science lifecycle is always an iterative process. (This includes both those building the models and those hoping to utilize the models.) We’ll frequently make discoveries in later steps and have to go back a step or two to build better models.
Start small
While it’s tempting to try to get buy-in within your organization by tackling that big problem that everybody has been wanting to solve, it’s often better to start with a small challenge that has a well-defined problem statement and easily accessible data, especially if this is your first time building models.
Building confidence in your models and figuring out your workflow is part of the process. It’s good to test all phases of the process on a less-complicated model to ensure the process works without adding in complications that can come from working with a more difficult/complex model.
Defining your problem, goals, and measuring success
One of the reasons a data science task may fail is because there isn’t a well-defined problem statement or goal. Knowing that you want to improve the outcome of something but not knowing exactly what constitutes an improvement can make it difficult to build a model and collect the data you need. A well-defined problem should identify what is being measured, how that measurement relates to the goal, and what counts as success.
Keep in mind that usage of a model as part of a preventative measure may change the underlying data and may make your initial forecasts look incorrect because your results have changed the behavior of the data being measured. In those cases, you may need to determine success using something other than how well the forecast predicted the actual values.
Data!
Once you have a well-defined problem, you must identify what data you need. In some cases, the data you want may not exist. What can you do? You might be able to request a change to processes so that your organization starts collecting the data you need. In other cases, it may not exist within your organization, but it may be something you can get from somewhere else (for free or by purchasing it).
Once you find the data you need, you’ve got to ensure you have contractual rights to use the data and the technical permissions to access the data wherever it’s stored. After you’ve located the data and have permission to use it, you also need to consider how you get the data. Often data scientists are not analyzing the data in the same place as where the data “lives,” so you’ve got to figure out how to get the data into the tools you want to use to analyze the data and build models. (Organizations may not want analysis being done on production databases for a variety of reasons, such as slowing down clients who are using the same database or the potential to accidentally overwrite or delete the original data.) The specifics of how you access your data often depend on where your data is hosted. Sometimes data collection requires accessing the data via an API, other times you may have to import the data from a CSV, which could be the output from an SQL query.
Identify toolsets
There are many tools you can use for data science. Some you must license and pay for, while others are open source and free. I’m a fan of using Python for data science, especially Jupyter notebooks for the early stages of data and model exploration. It’s a great option for being able to document your approach and share the results with others. If you don’t know how to program, there are options like Azure ML Studio, which is a great click-and-drag option for playing with machine learning algorithms. There are a ton of great resources online for learning to use these tools and becoming your own citizen data scientist.
Present your results
Once you define your problem, collect data and create a model, how do the results get incorporated into your workflow? The entire purpose of building the algorithm is to get to the point where you can communicate the results to facilitate data-driven decisions. However, this can be one of the larger barriers that data scientists face.
Typically, results are returned in one of two ways:
- communicated to the stakeholders via reports and dashboards, or
- communicated to services.
For the first phase, most likely you’ll just be creating reports or dashboards to share. (Remember, you’re starting small.)
At this point, most results are displayed in presentations. The difficulty with a slide presentation is that it is static reporting, and when questions come up about the analysis (“What if we filter down just to this time range?” “How does that affect the results?”), you likely have to get back to the stakeholder later with updated results, unless you predicted those questions would come up and prepared variations in your analysis.
While this is OK in the early phases of the data science workflow, this isn’t where we want to end.
Keep an eye out for the next post in this three-part series to learn how to transition into the second phase of bringing data science into your organization.
Get our take on industry trends

Beyond care gap closure: Rethinking clinical strategy in Medicare Advantage
Closing care gaps has become a core focus for Medicare Advantage plans for good reason. Gap closure directly impacts Star Ratings, quality…
Read on...
From awareness to action: Unlocking the financial value of SDOH
Social determinants of health (SDOH) have become one of healthcare’s biggest strategic priorities, but many organizations still struggle with how to…
Read on...
Enterprise Analytics for Medicare Advantage: Why unified intelligence is the future of MA performance
Medicare Advantage organizations are facing growing pressure to improve quality outcomes, optimize financial performance, reduce compliance risk, and deliver better member experiences, all…
Read on...
Where Medicare Advantage revenue leaks: The disconnect between RAF, Star Ratings, and MLR
Most Medicare Advantage revenue loss doesn’t show up where finance teams expect it. It’s not a single variance in a report or a clear…
Read on...