Best practice tools to build an integrated approach to multimorbidity
The traditional model of treating single diseases no longer works.
Data collected from 2016 to 2019 indicated that 32.9% of US adults had multiple chronic conditions—and that attempting to address these issues individually and separately is ineffective and costly. This fact is particularly poignant for Medicaid populations, who are significantly more likely to suffer from multimorbidity than non-Medicaid patients.
Multimorbidity disproportionately affects those with lower socioeconomic status and the elderly, impairing daily functioning, reducing quality of life, and severely impacting mental health. Further, multimorbidity of chronic conditions leads to poorer outcomes in patients and increases the burden of treatment and associated costs.
Medicaid plans and providers must take a proactive and comprehensive approach to patient care, but it’s easier said than done. In this blog post, get analytics-powered strategies and accompanying tools that can help you improve outcomes for the most at-risk members.
Strategies to improve member outcomes
1. Issue: Individuals living in areas of high socioeconomic deprivation develop multimorbidity 10-15 years earlier than those living in affluent areas.
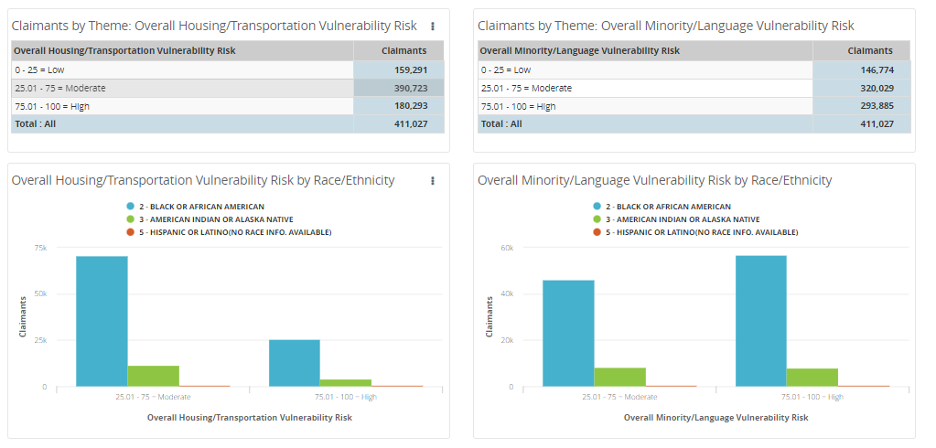
Strategy: To understand and support their members, health plans must identify those living in areas of increased risk for overall socioeconomic vulnerability.
Tool: CDC/ATSDR Social Vulnerability Index > Examine member risk from all angles, including housing, transportation, and language barriers.
2. Issue: When chronic diseases are addressed individually, patients often experience unnecessary suffering and mismanaged care.
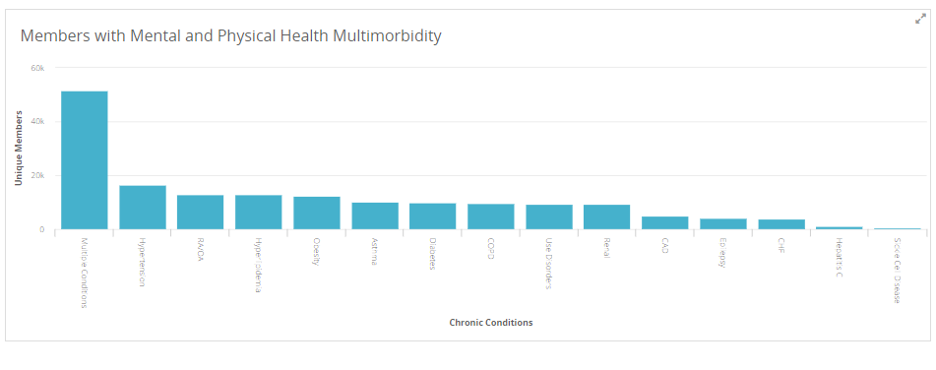
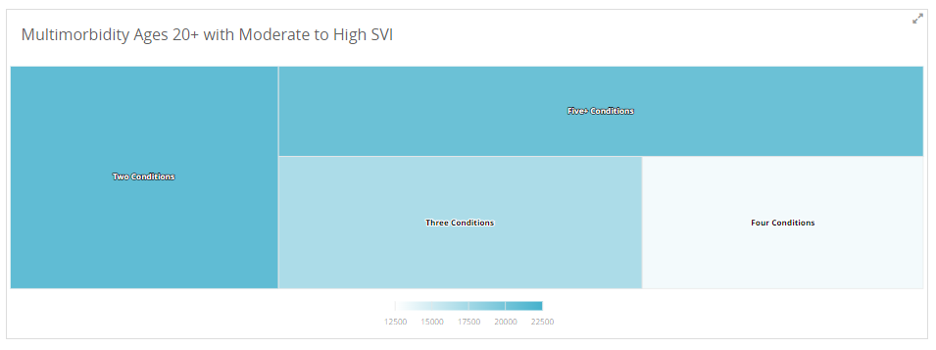
Strategy: Health plans must implement integrated, multimorbidity care models that prioritize careful care coordination, self-management support for patients, and community support initiatives.
Tool: Multimorbidity Dashboards > Identify the top clusters for a given population, stratify by race/ethnicity, age, and socioeconomic risk, and drill down to patient-level detail to enable care management and facilitation programming.
3. Issue: Members with multiple chronic conditions often require polypharmacy—using multiple drugs to treat diseases and other health conditions—which is complex and can be dangerous. Previous studies have shown that approximately 20% of hospital readmissions can be medication-related and 70% of these readmissions are possibly preventable.
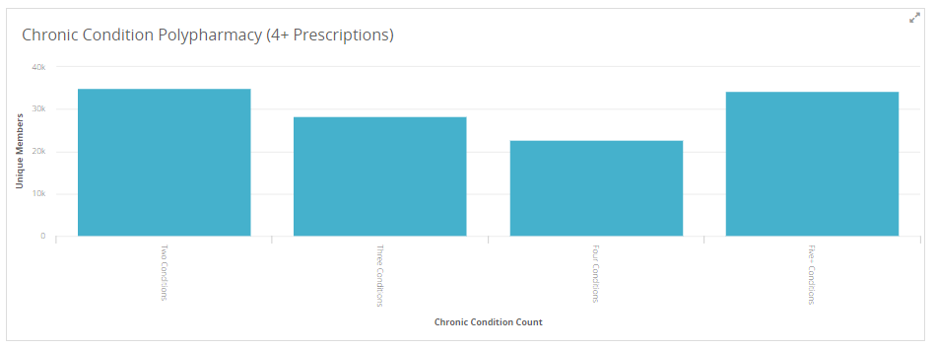
Strategy: Identify members with multiple chronic conditions who are currently prescribed four or more prescriptions.
Tool: Polypharmacy Dimensions Report > Keep close track of members’ prescription prevalence and disease development to avoid adverse effects of polypharmacy, such as falls, drug interactions, and drug-disease interactions.
The importance of patient engagement
Using data to improve clinical outcomes is just one part of the care delivery equation in Medicaid. Another critical element is engaging members with their health and care needs.
To serve the Medicaid population effectively, plans need to get members in the door to access comprehensive care provided by empathetic clinicians, as well as resources to address fundamental barriers to health. Strong analytics platforms use data points to help health plans understand which members aren’t engaging in care, what barriers they are experiencing, and how to overcome those obstacles.
Analytics also offer health plans the ability to understand which providers have consistently higher member engagement or which are accepting a larger number of Medicaid members.
In conclusion
Multimorbidity is a complex, challenging issue facing millions of Americans—and their health plans. To address member needs holistically, Medicaid plans must apply data strategically, as data is only an effective tool when it can be used to drive action. At MedeAnalytics, our mission is to empower health plans with robust data analytics platforms and tools necessary to get their members the right care, from the right people, in the right place and at the right time.
Get our take on industry trends

Looking back at HIMSS22
Our MedeAnalytics team was thrilled to be back in person for this year’s HIMSS event, after a two-year hiatus due…
Read on...
A look ahead at payer analytics innovation
Pioneering payers know that building a strong foundation is the key to enacting sustainable innovation. This foundation typically includes the…
Read on...
Providers: Are you ready to be audited?
By Donna Kennedy In 2020, regular audits conducted by CMS and other payers were paused or significantly reduced as the…
Read on...
From Insights to Action – The Digital Transformation of Healthcare in the Post-Pandemic “New Normal”
In November, MedeAnalytics hosted the 2021 Impact Summit, an engaging and educational event held annually and designed exclusively for our…
Read on...