Avoid COVID-19 modeling pitfalls by eliminating bias, using good data

Predictive modeling is the multifaceted pursuit to understand what may happen in the future using specific pieces of data from the past. Around the world, data scientists are creating models and using a variety of inputs in an attempt to forecast the impact of the coronavirus.
Kim Babberl of the MedeAnalytics Product Consulting team explores the complex and fascinating world of modeling and the effect it can have on your organization’s decisions as they relate to the coronavirus in the article below.
As always, stay safe and healthy.
Andrea Sorensen, associate vice president, Product Consulting, MedeAnalytics
Avoid COVID-19 modeling pitfalls by eliminating bias, using good data
By Kim Babberl
COVID-19 models are being used every day to predict the course and short- and long-term impacts of the pandemic. And we’ll be using these COVID-19 models for months to come. While many of us in healthcare are not epidemiologists or data scientists, we’re all sifting through the data to get a handle on how many people are going to get sick, how many will end up in the hospital or on a ventilator, and ultimately, how many people will die.
Government agencies are using models to set public policy, such as social distancing or shelter-in-place mandates, but confusion sets in because the various models often disagree. To understand the inherent disagreement in models, you must look at what goes into their development. Having this information will help you determine the best way to use and interpret predictive COVID-19 models.
Building a Model
For most of us, the process behind developing a model seems a little bit like the Wizard of Oz. It’s hard to pull back the curtain on the underlying details to understand how they work together to generate the ultimate output: predicting the future.
To appreciate the power of a model’s predictions, it’s important to start with the inputs. Model-building is an iterative (and non-linear) process with five basic steps:
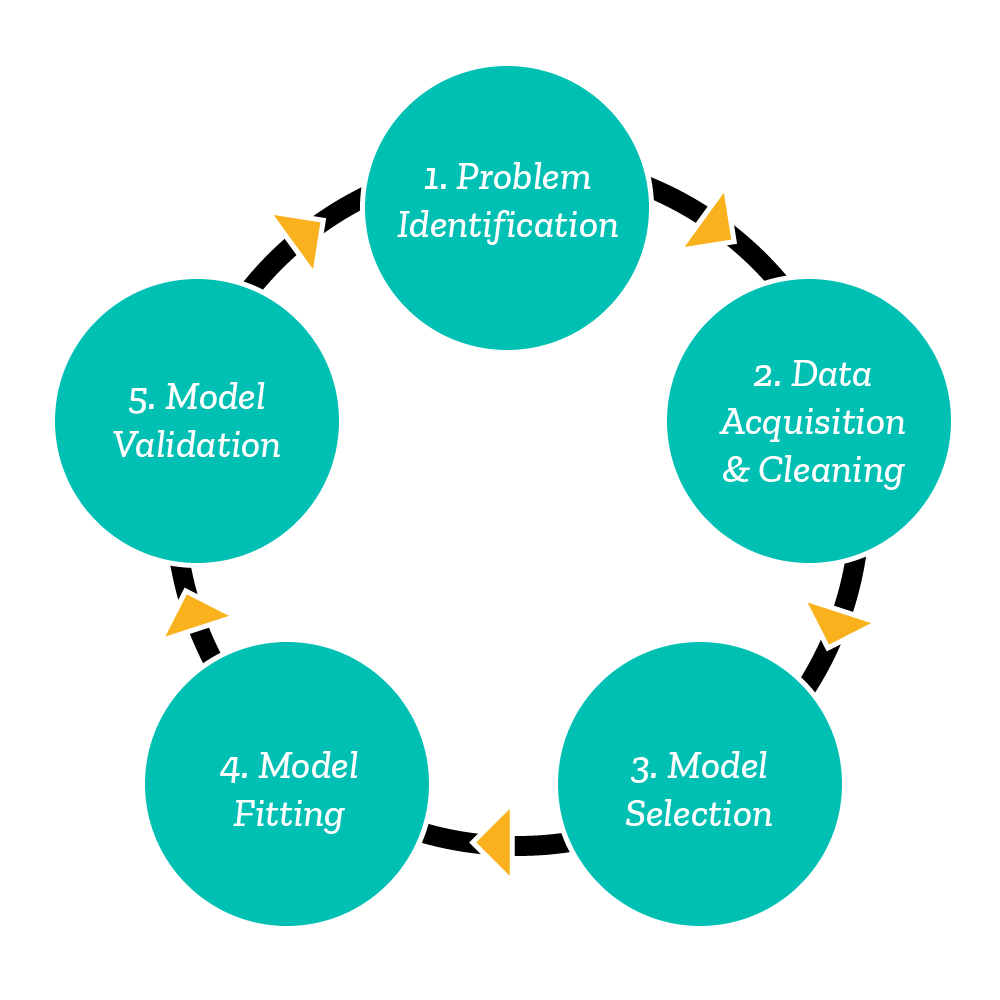
1. Problem identification A critical part of the process is identifying what you are trying to solve for, which in turn will help you identify the data needed for the model and narrow the types of models to test.
2. Data acquisition and cleaning This step consumes a significant portion of the time it takes to build a model. It is incredibly important to ensure the data is clean and accurate. Bad data produces bad models and ultimately leads to poor decision-making: garbage in, garbage out. (You also may need to return to data acquisition and cleaning multiple times throughout the model-building lifecycle.)
3. Model selection When selecting test models, you’ll need to select the features (input variables) to help the model predict the target variable (model output). In the COVID-19 models, examples of features and target variables include:
| Features | Targets |
|---|---|
| Age, Gender, Ethnicity, Underlying Chronic Conditions | Classification of High Risk or Low Risk |
| • Percent of social distancing observed by population • Population density of location • Date of first case of COVID-19 detected • Percent of patients classified as high risk | • Number of positive COVID-19 cases • Number of patients who end up in ICU • Number of patients who need a ventilator • Number of deaths |
4. Model fitting Use of different features, models and parameters for the same model, or even different data sources for the same target variables, will significantly impact the prediction.
5. Model validation In building the model, you must thoroughly investigate data sources, methodologies used and assumptions made before accepting any predictions as reality.
How Certain is Certain?
It’s difficult to be certain about the outcomes derived through a predictive model because of the model’s inherent uncertainty.
Outputs are sometimes deemed to be facts, rather than the probability-driven predictions they really are. As statistician George Box famously said, “All models are wrong, but some are useful.” When a COVID-19 model predicts 120,000 US deaths, many people:
- Accept that with a degree of certainty, such as “This is what will happen”; and
- Apply a level of exactness to it, such as “Exactly120,000 people will die,” despite the range of probabilities.
Both are dangerous approaches to decision-making.
For example, using data as of May 10, 2020, the IHME (Institute for Health Metrics and Evaluation) estimates COVID-19 related deaths in the US will reach 137,184 by August 4. Other models, however, state the range of probable deaths is 100,000 to 220,000, a wide span of variability when you’re talking about human lives. Many people don’t understand the importance of considering this range to account for probability when using models for decision-making. This range also only accounts for errors inherent in the model itself; it does not account for errors created by using bad data or mistakes made by the person training the model when selecting parameters.
Ultimately, when using COVID-19 models to drive policy and to inform operational, financial or clinical decisions, proceed with caution and be sure to look beyond the graphs to the underlying assumptions and supporting data, including the potential for bias. You may find for yourself and your organization that the best option is to use your data and train the models yourself to ensure you understand its mechanics. Make yourself the Wizard of Oz.
You can find examples of COVID-19 models and predictions in the links below. As noted at the Centers for Disease Control and Prevention website, “It is important to bring these forecasts together to help understand how they compare with each other and how much uncertainty there is about what may happen in the upcoming four weeks.”
Additional information about COVID-19 models can be found at:
Get our take on industry trends

Looking back at HIMSS22
Our MedeAnalytics team was thrilled to be back in person for this year’s HIMSS event, after a two-year hiatus due…
Read on...
A look ahead at payer analytics innovation
Pioneering payers know that building a strong foundation is the key to enacting sustainable innovation. This foundation typically includes the…
Read on...
Providers: Are you ready to be audited?
By Donna Kennedy In 2020, regular audits conducted by CMS and other payers were paused or significantly reduced as the…
Read on...
From Insights to Action – The Digital Transformation of Healthcare in the Post-Pandemic “New Normal”
In November, MedeAnalytics hosted the 2021 Impact Summit, an engaging and educational event held annually and designed exclusively for our…
Read on...